
The platform
One console for every layer of experience.
Replay, heatmaps, funnels, AI, vitals, uptime, traces, logs and hosts — every one of them reads from the same visit, on the same timeline. A failed click in the player is a step in the funnel, a card in the insights, a span on the server.
A click that failed, and the outage behind it.
A real visit to a storefront, followed through five capabilities. Nothing here was stitched together after the fact — it's the same recording, read five ways.
- Session Replay · 0:24
A visitor tries to add a jacket. The cart API answers 500 — three times.
The replay shows the click, the failed POST, the console error and the alert the visitor saw, with the request's headers and timing docked beside the stage.
Session Replaylive/sessions/b8c8ca3eapp.logclip.com/sessions/b8c8ca3e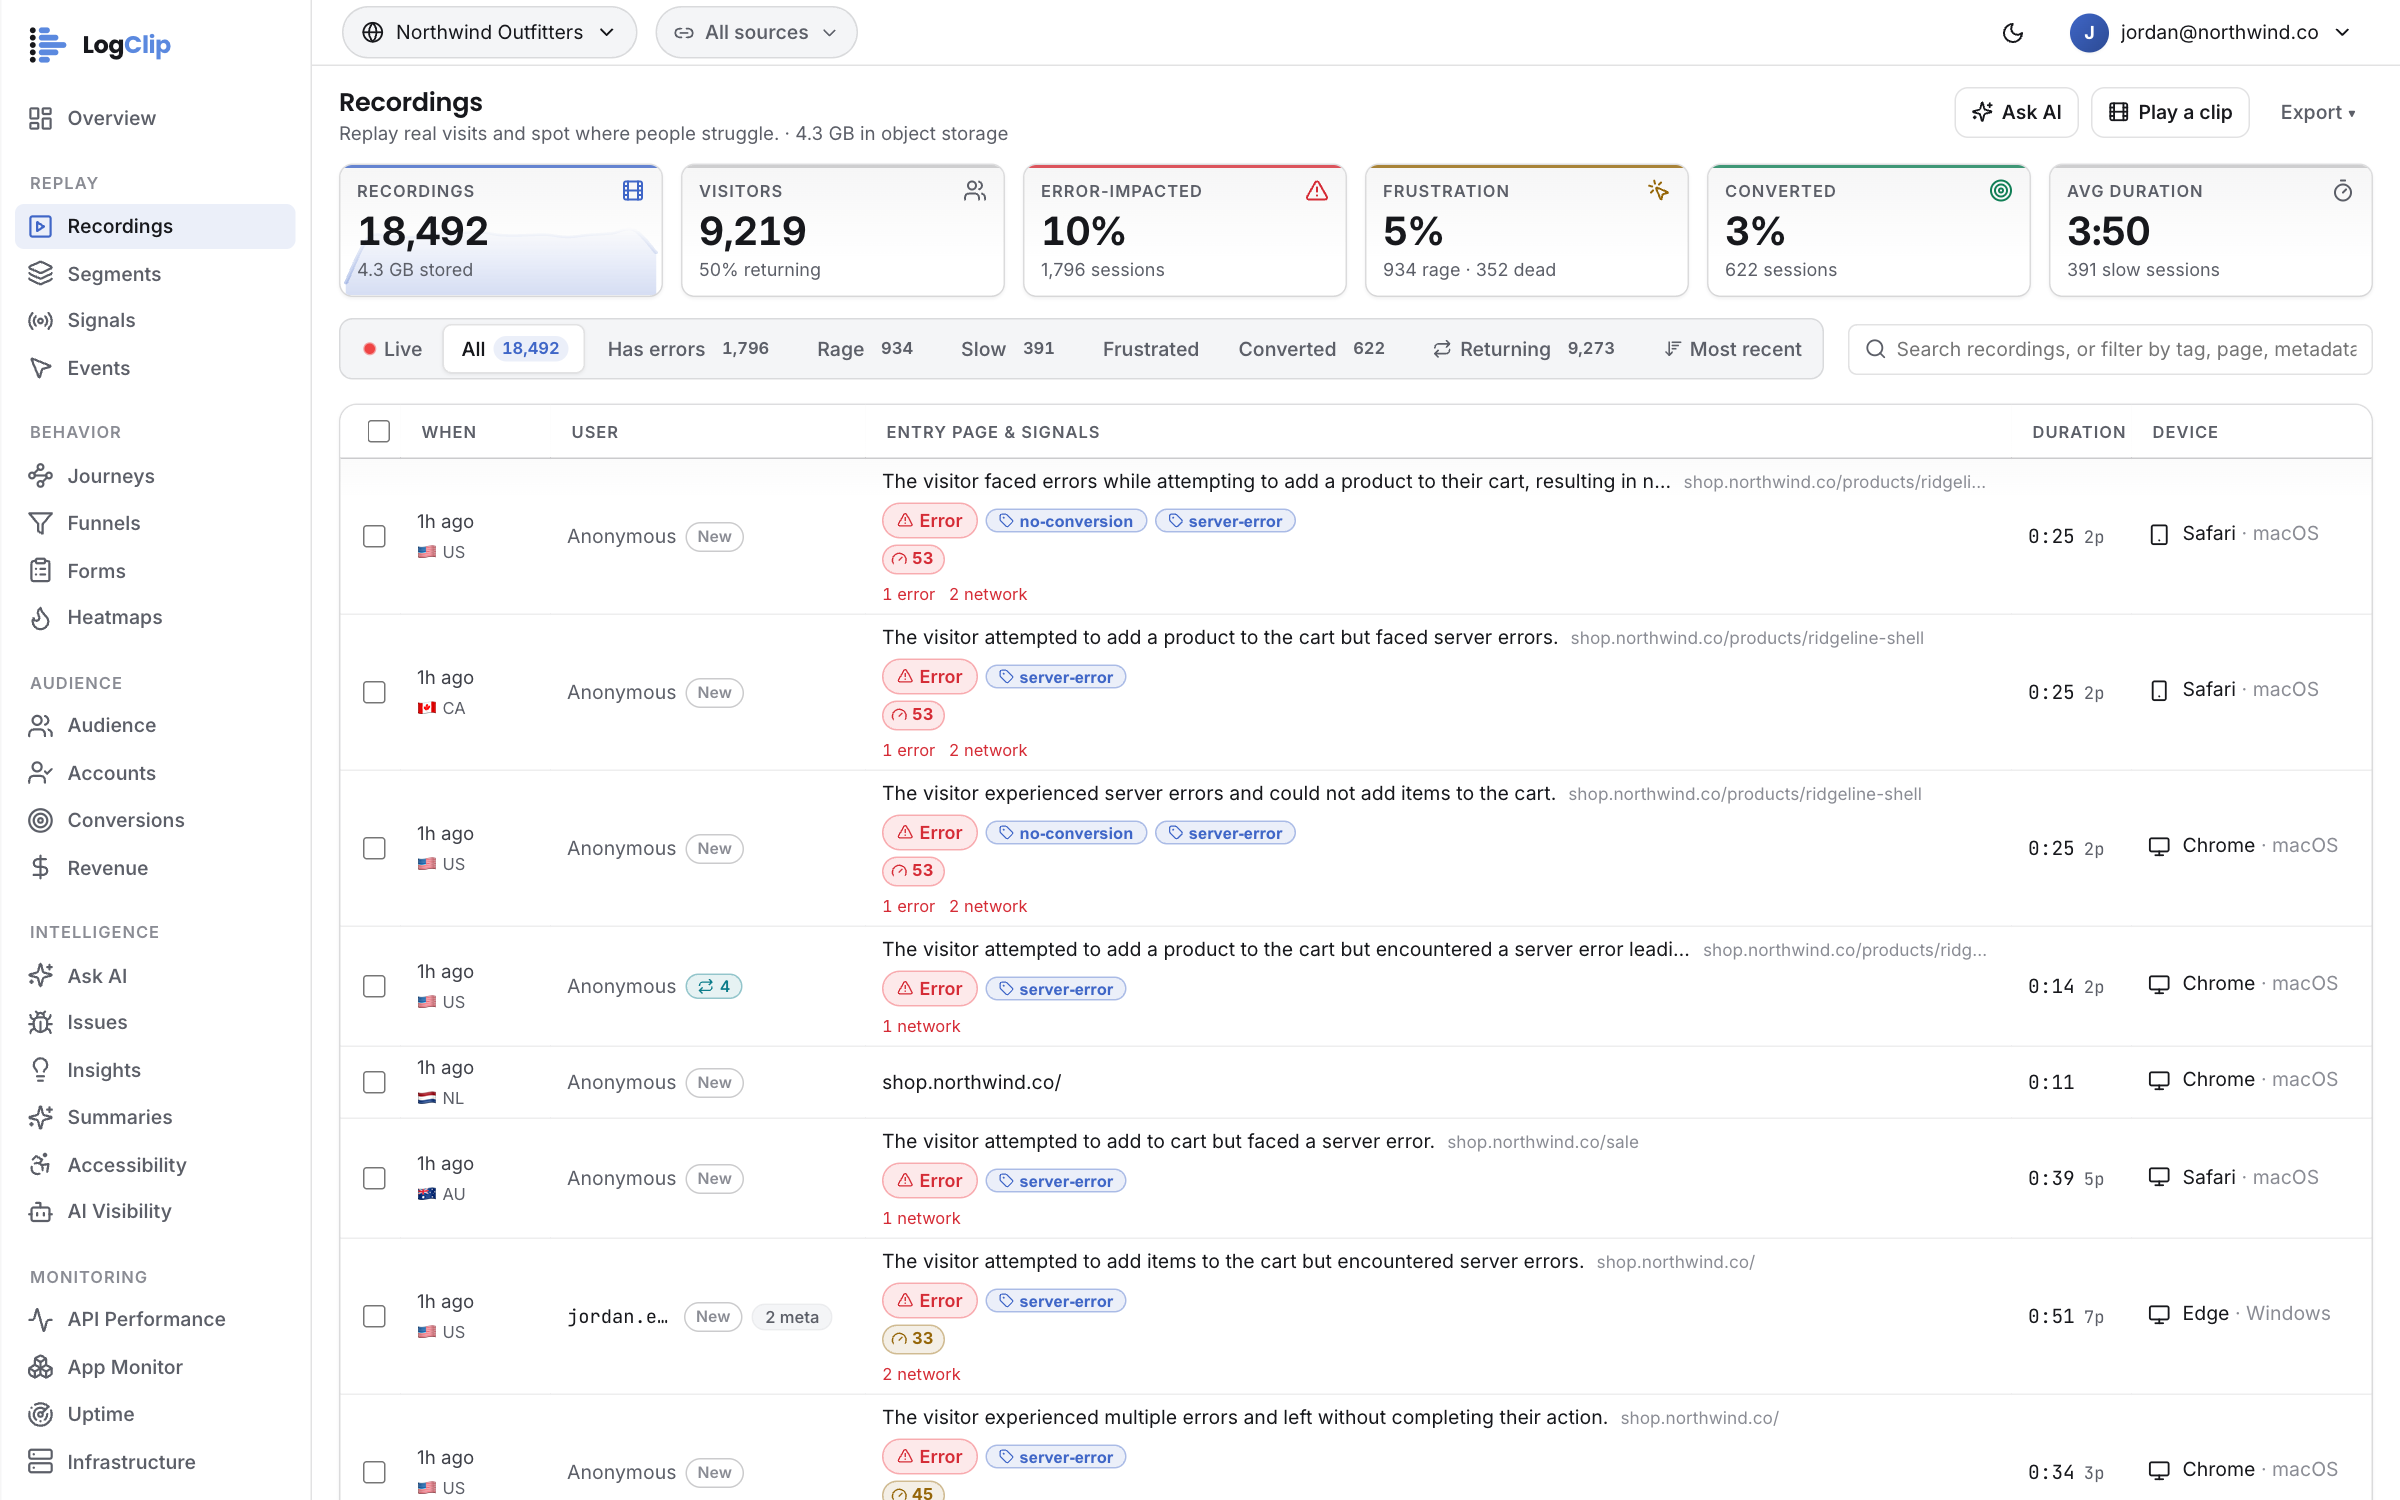
- Funnels · step 3 of 5
It isn't one visitor. The funnel loses them between product and cart.
Five steps from landing to purchase, with the drop at each one. The widest gap is the step this failure sits on — click it and the sessions behind the number queue up.
Funnelslive/funnelsapp.logclip.com/funnels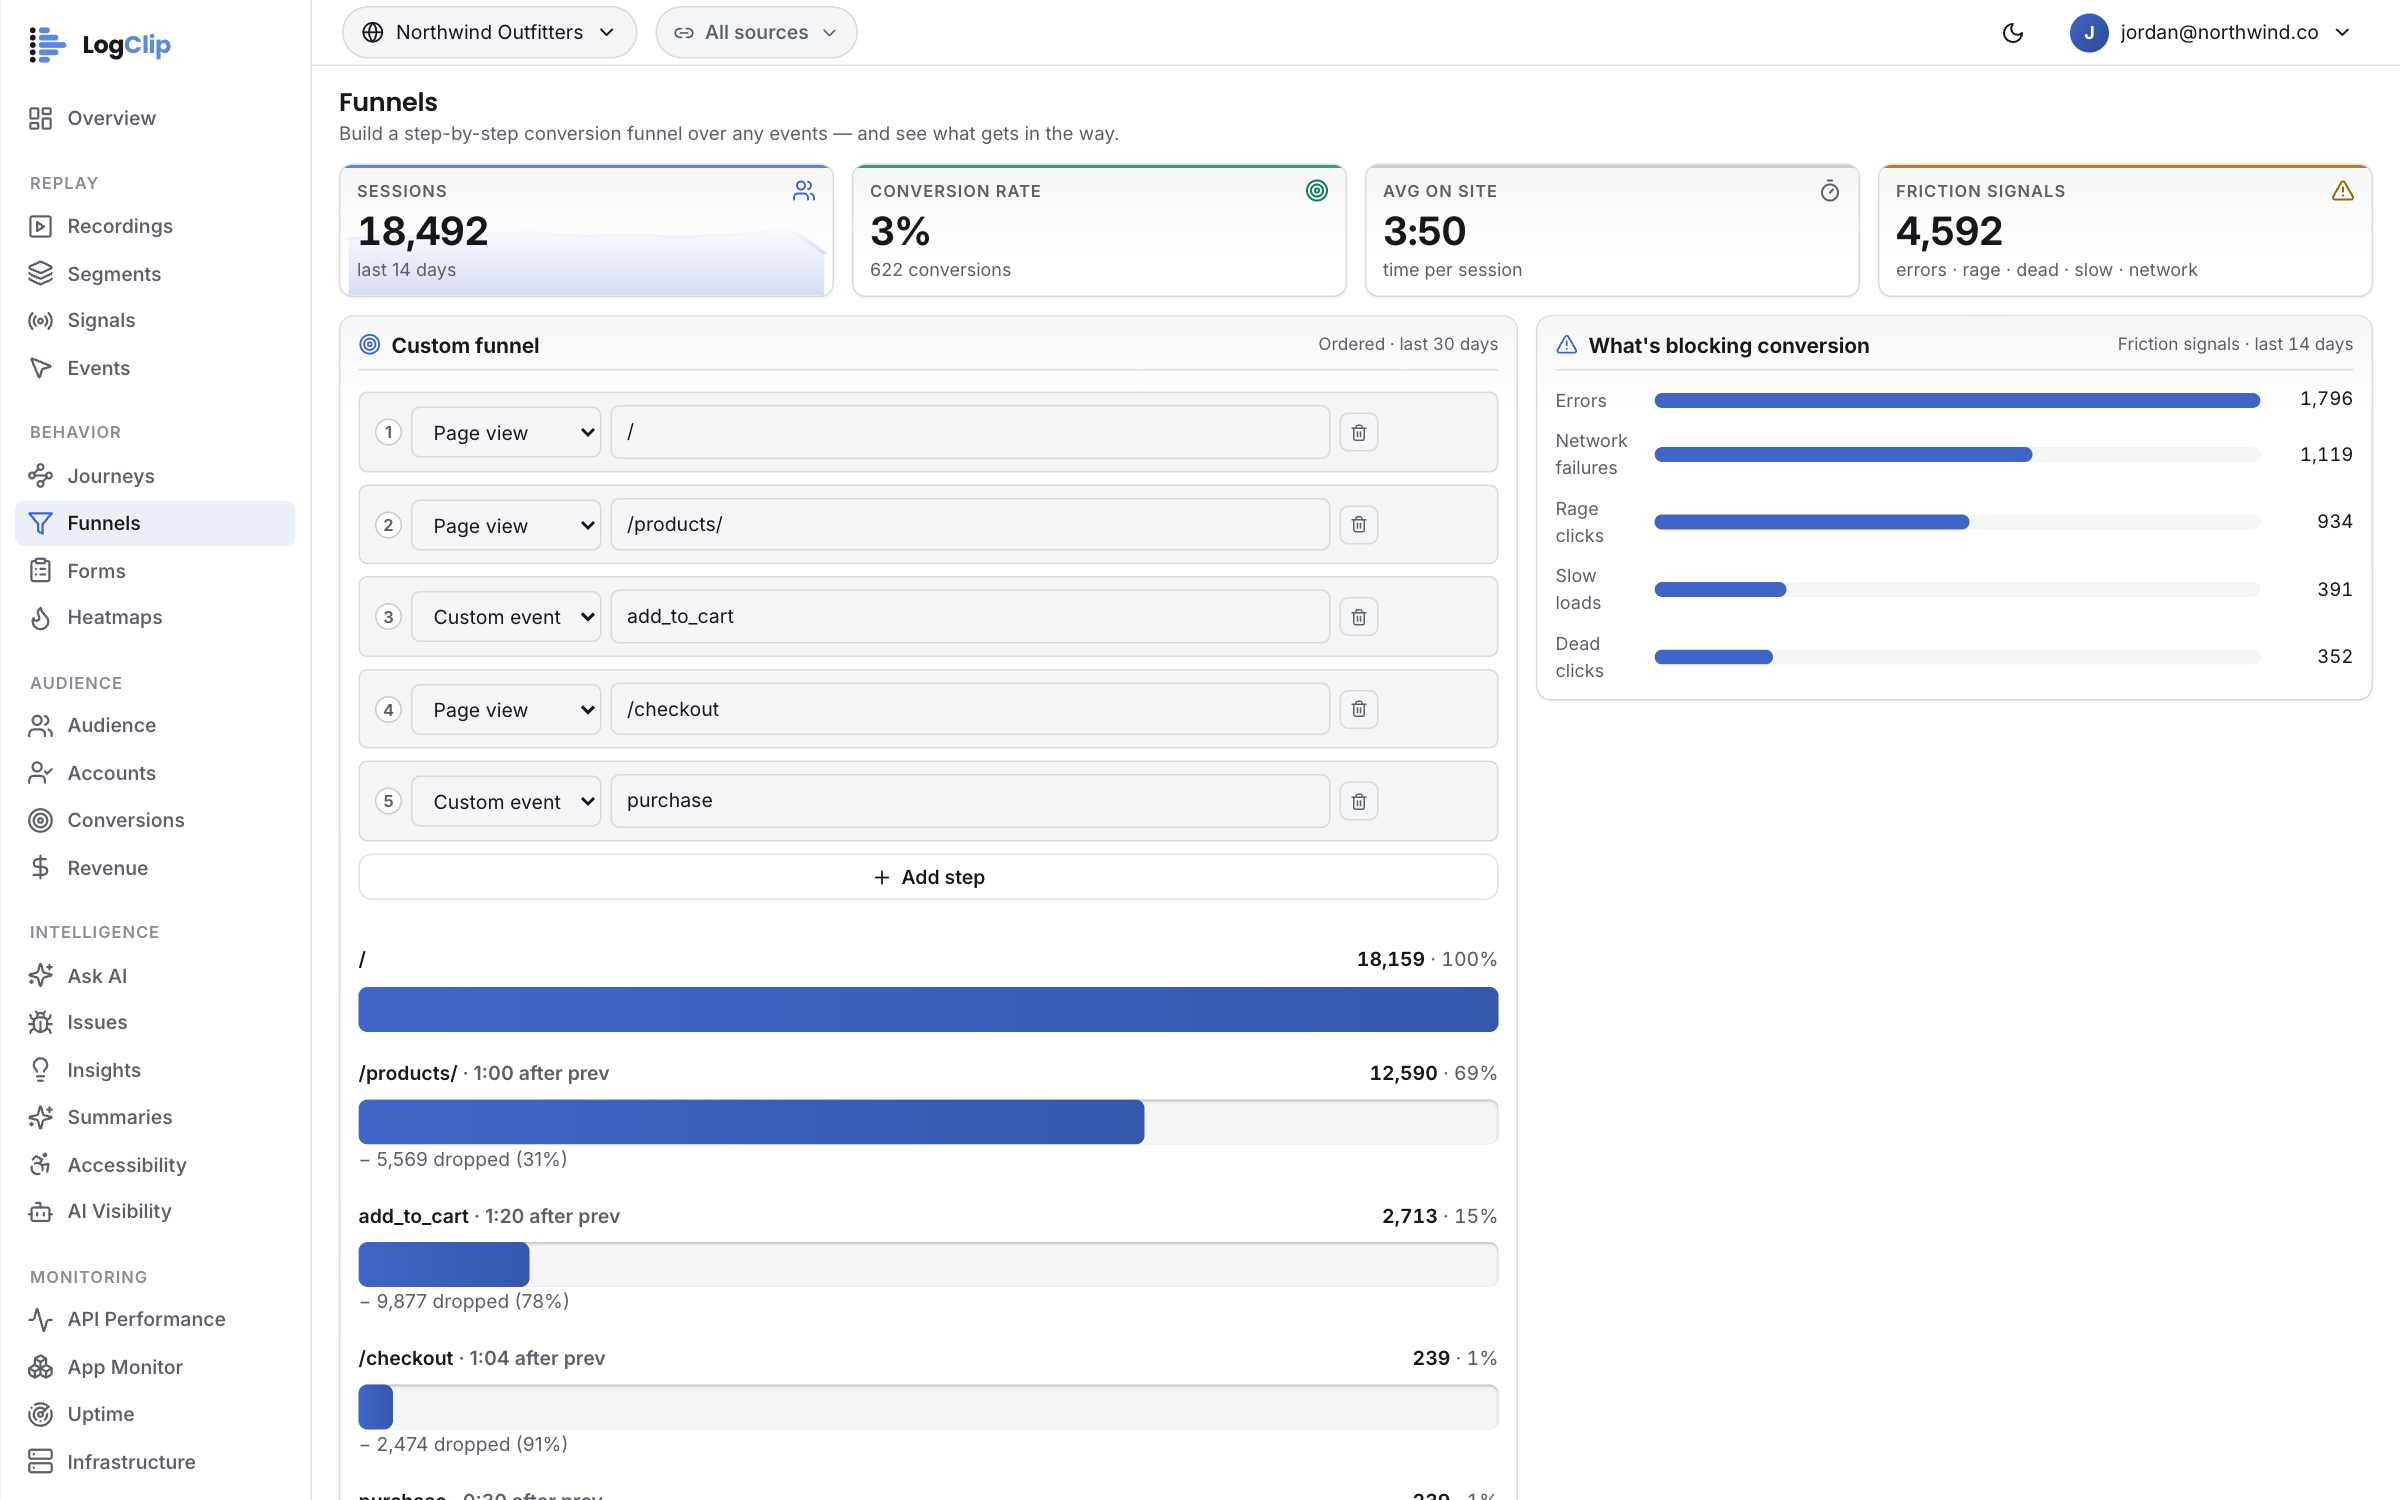
- AI Insights · cause card
The cause card has already named it: cart service unavailable, 588 sessions.
Failures ranked by the conversions they cost, with the error text, a Watch link to the recordings and a Track button. Nobody had to read ten thousand sessions to find it.
AI Insightslive/insightsapp.logclip.com/insights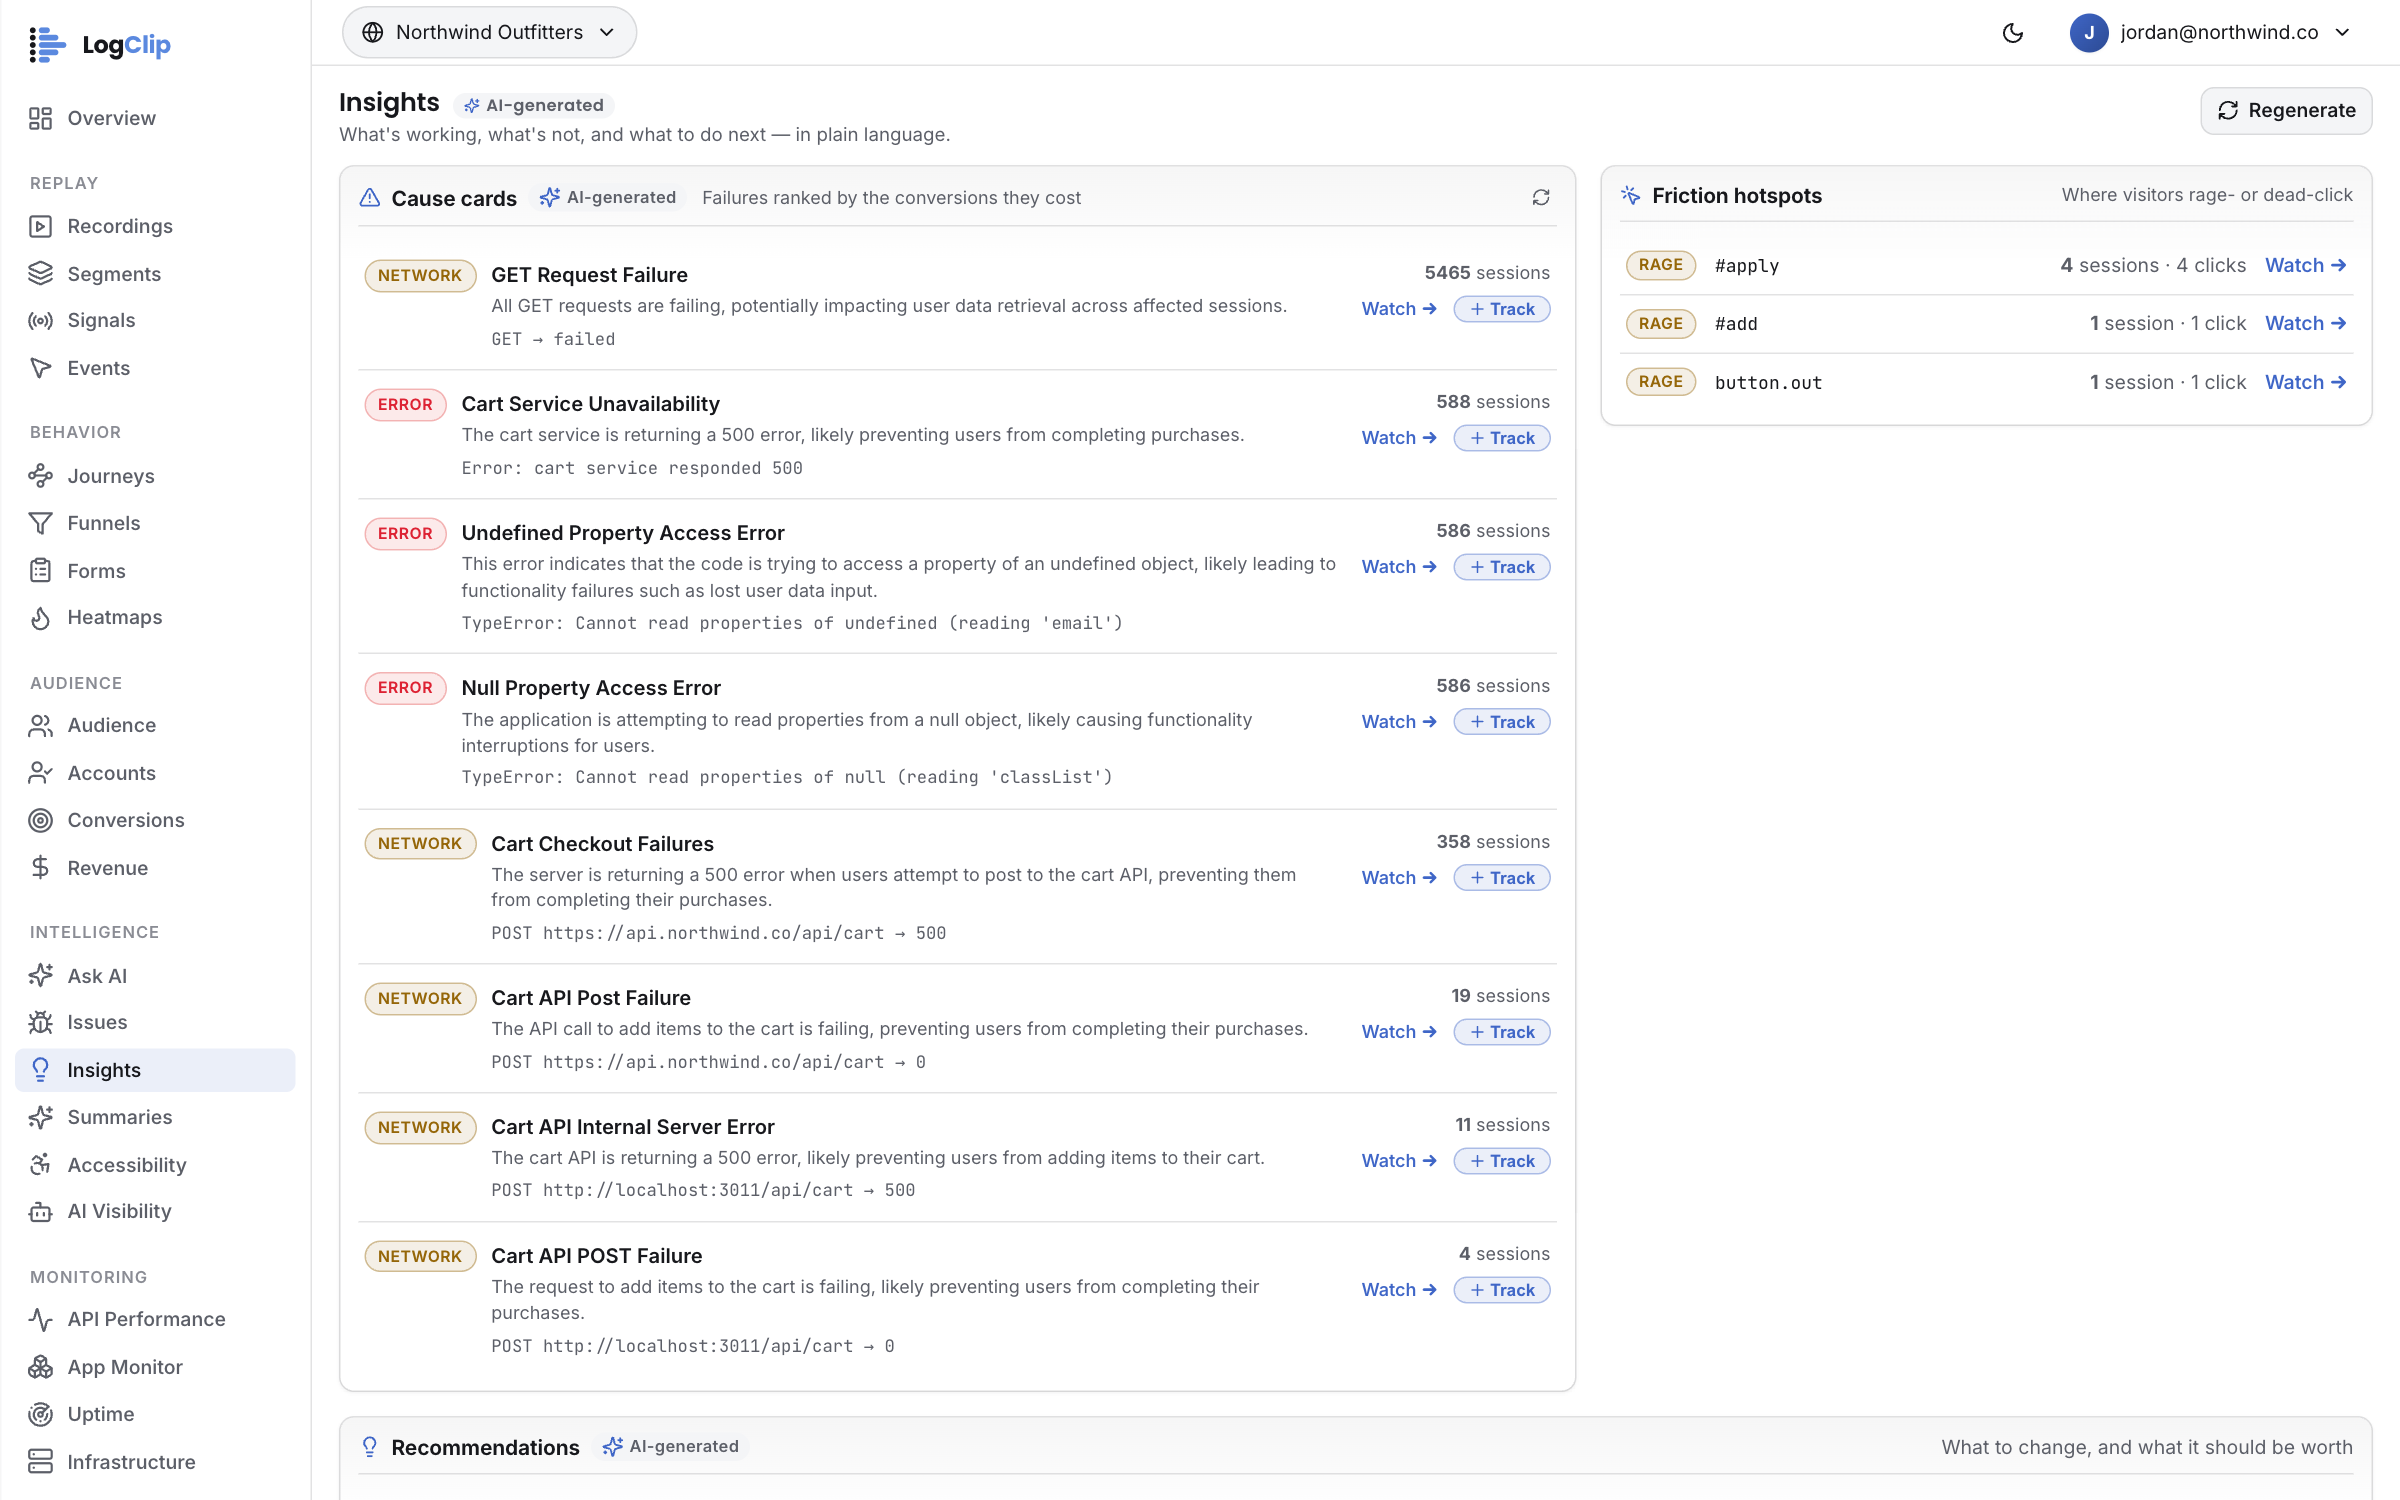
- App Monitor · POST /api/cart
On the server it's the same request — 2.8% errors, p95 173 ms.
The failed request in the replay opens the trace that produced it: the endpoint, the query, the third-party call. Browser and backend on one timeline, no second tool.
App Monitorlive/app-monitorapp.logclip.com/app-monitor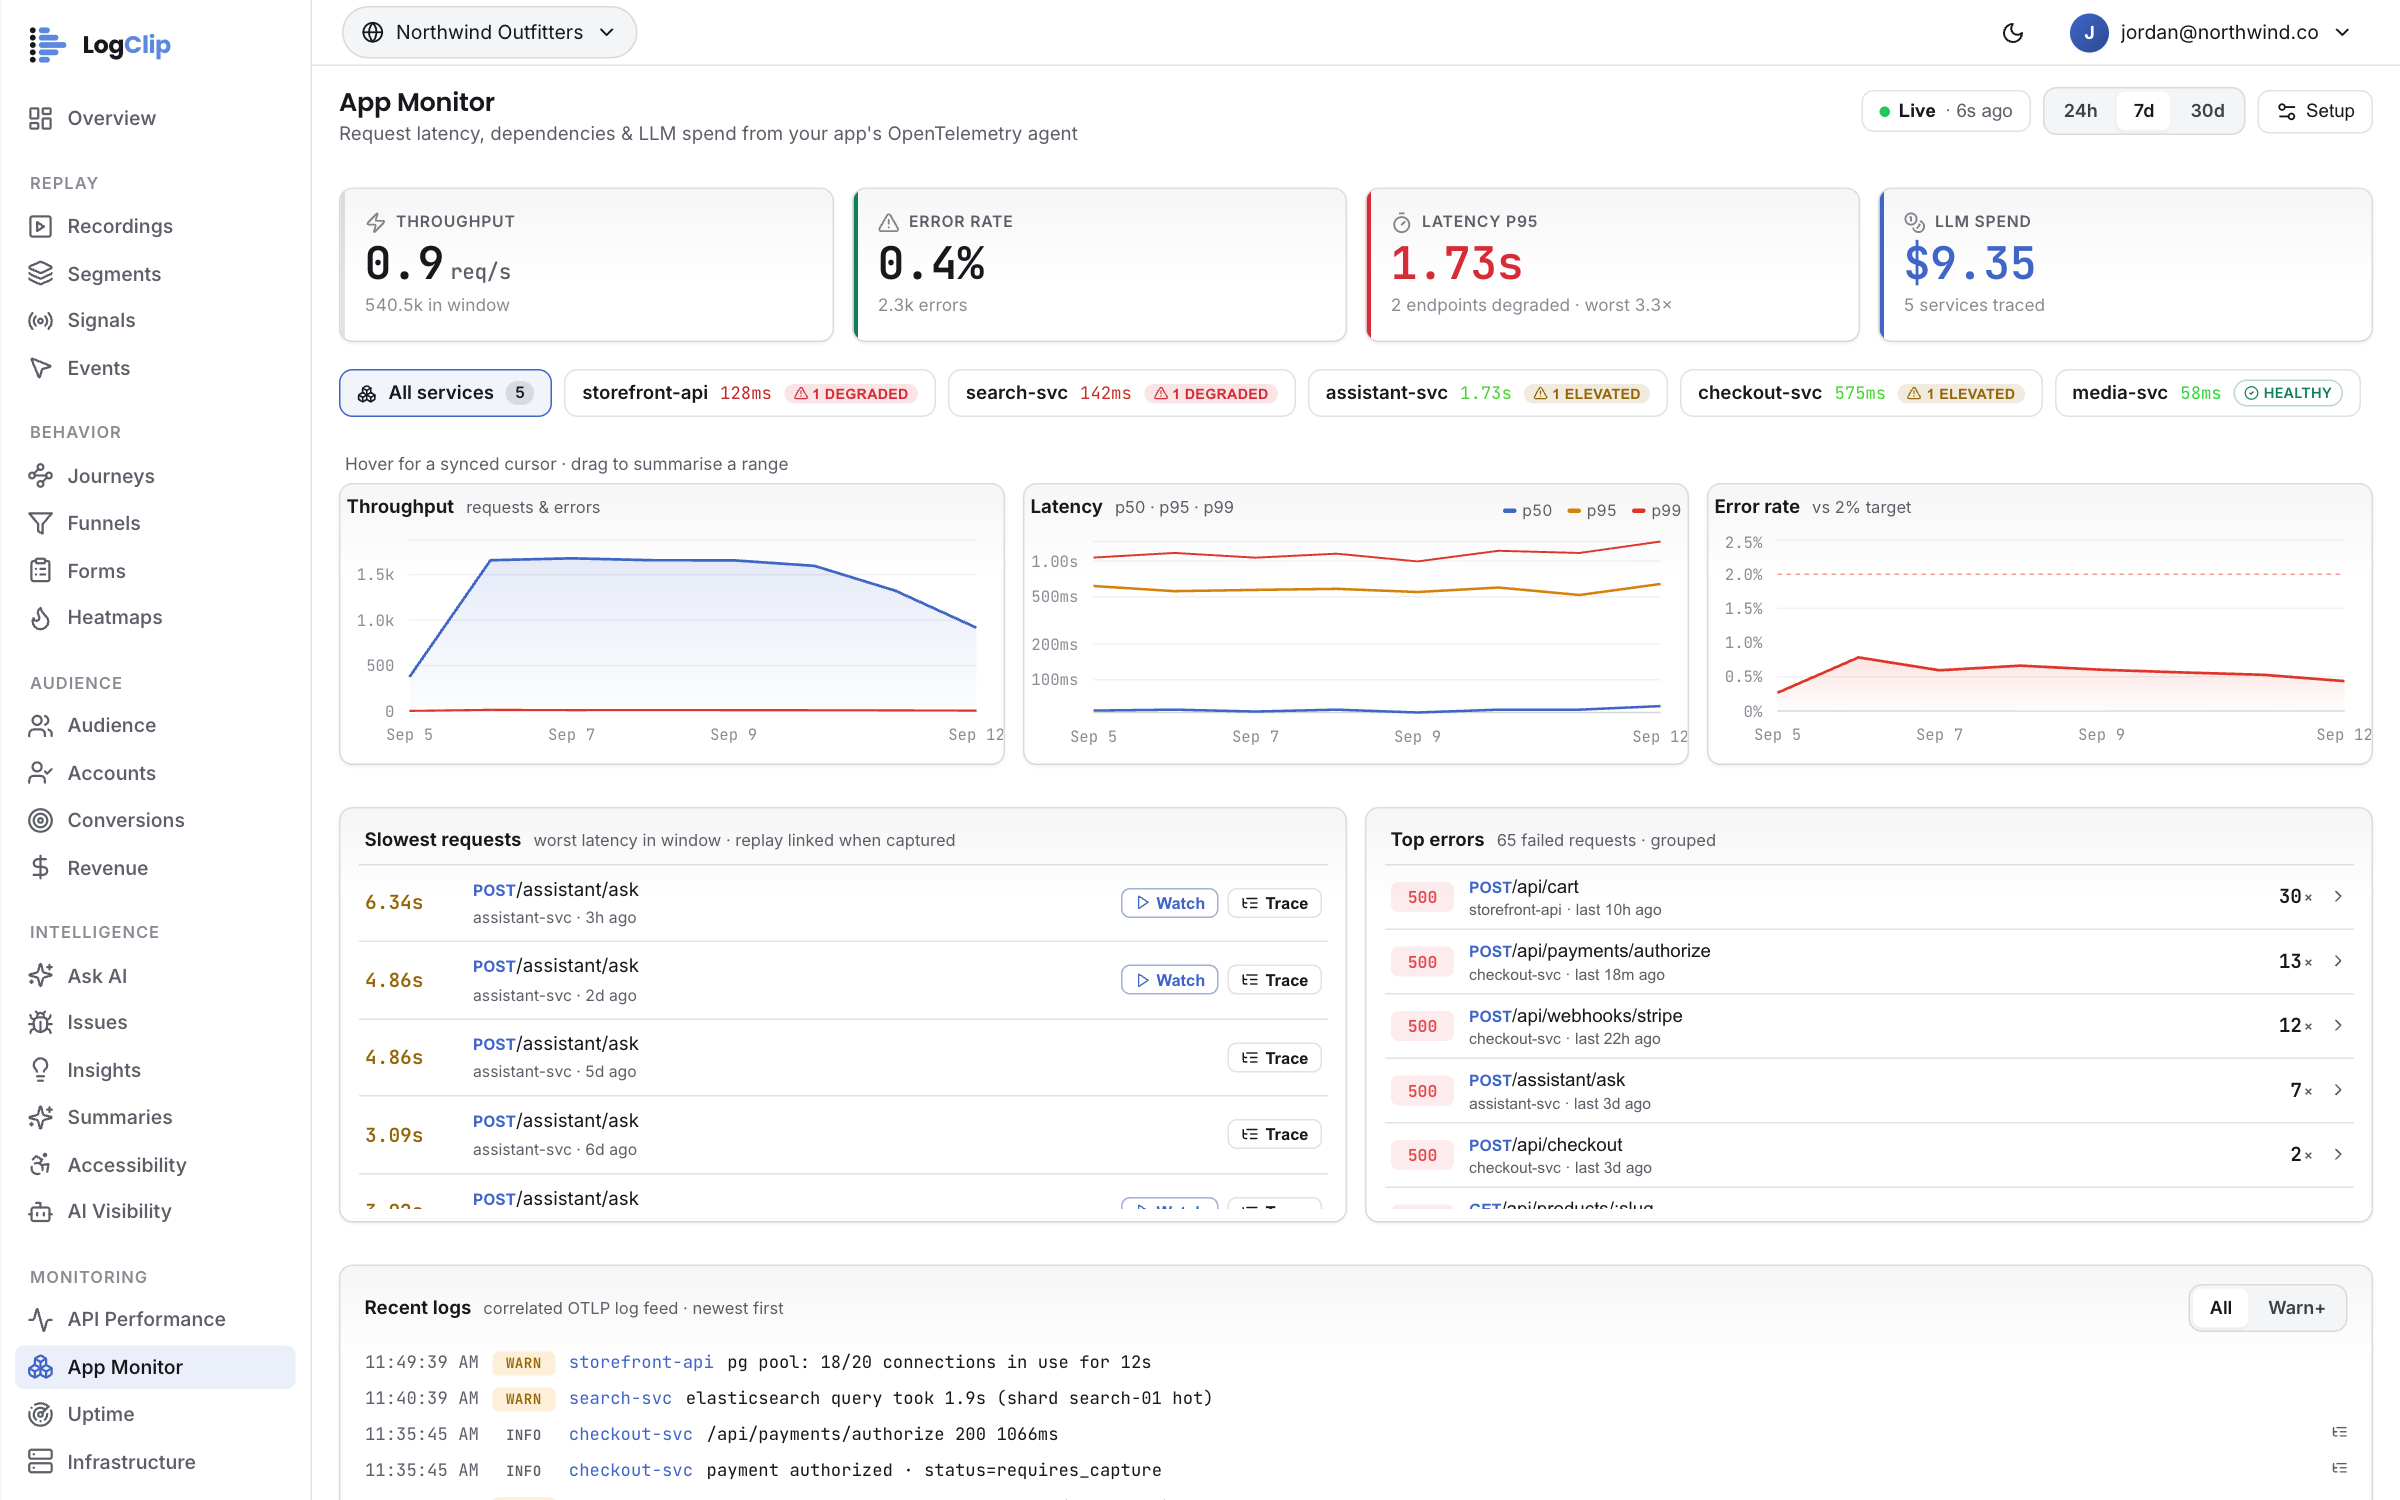
- Infrastructure · db-01 · memory 98%
And underneath, the box ran out of room: memory at 98%, swap climbing.
One agent per host, reading the machine every ten seconds — memory pushed to 98% from a steady 82%, swap from 30% to 50%, CPU and I/O pressure climbing with them, on the same clock as the session. “Was the server struggling when that visitor was?” stops being an argument.
Infrastructurelive/infrastructureapp.logclip.com/infrastructure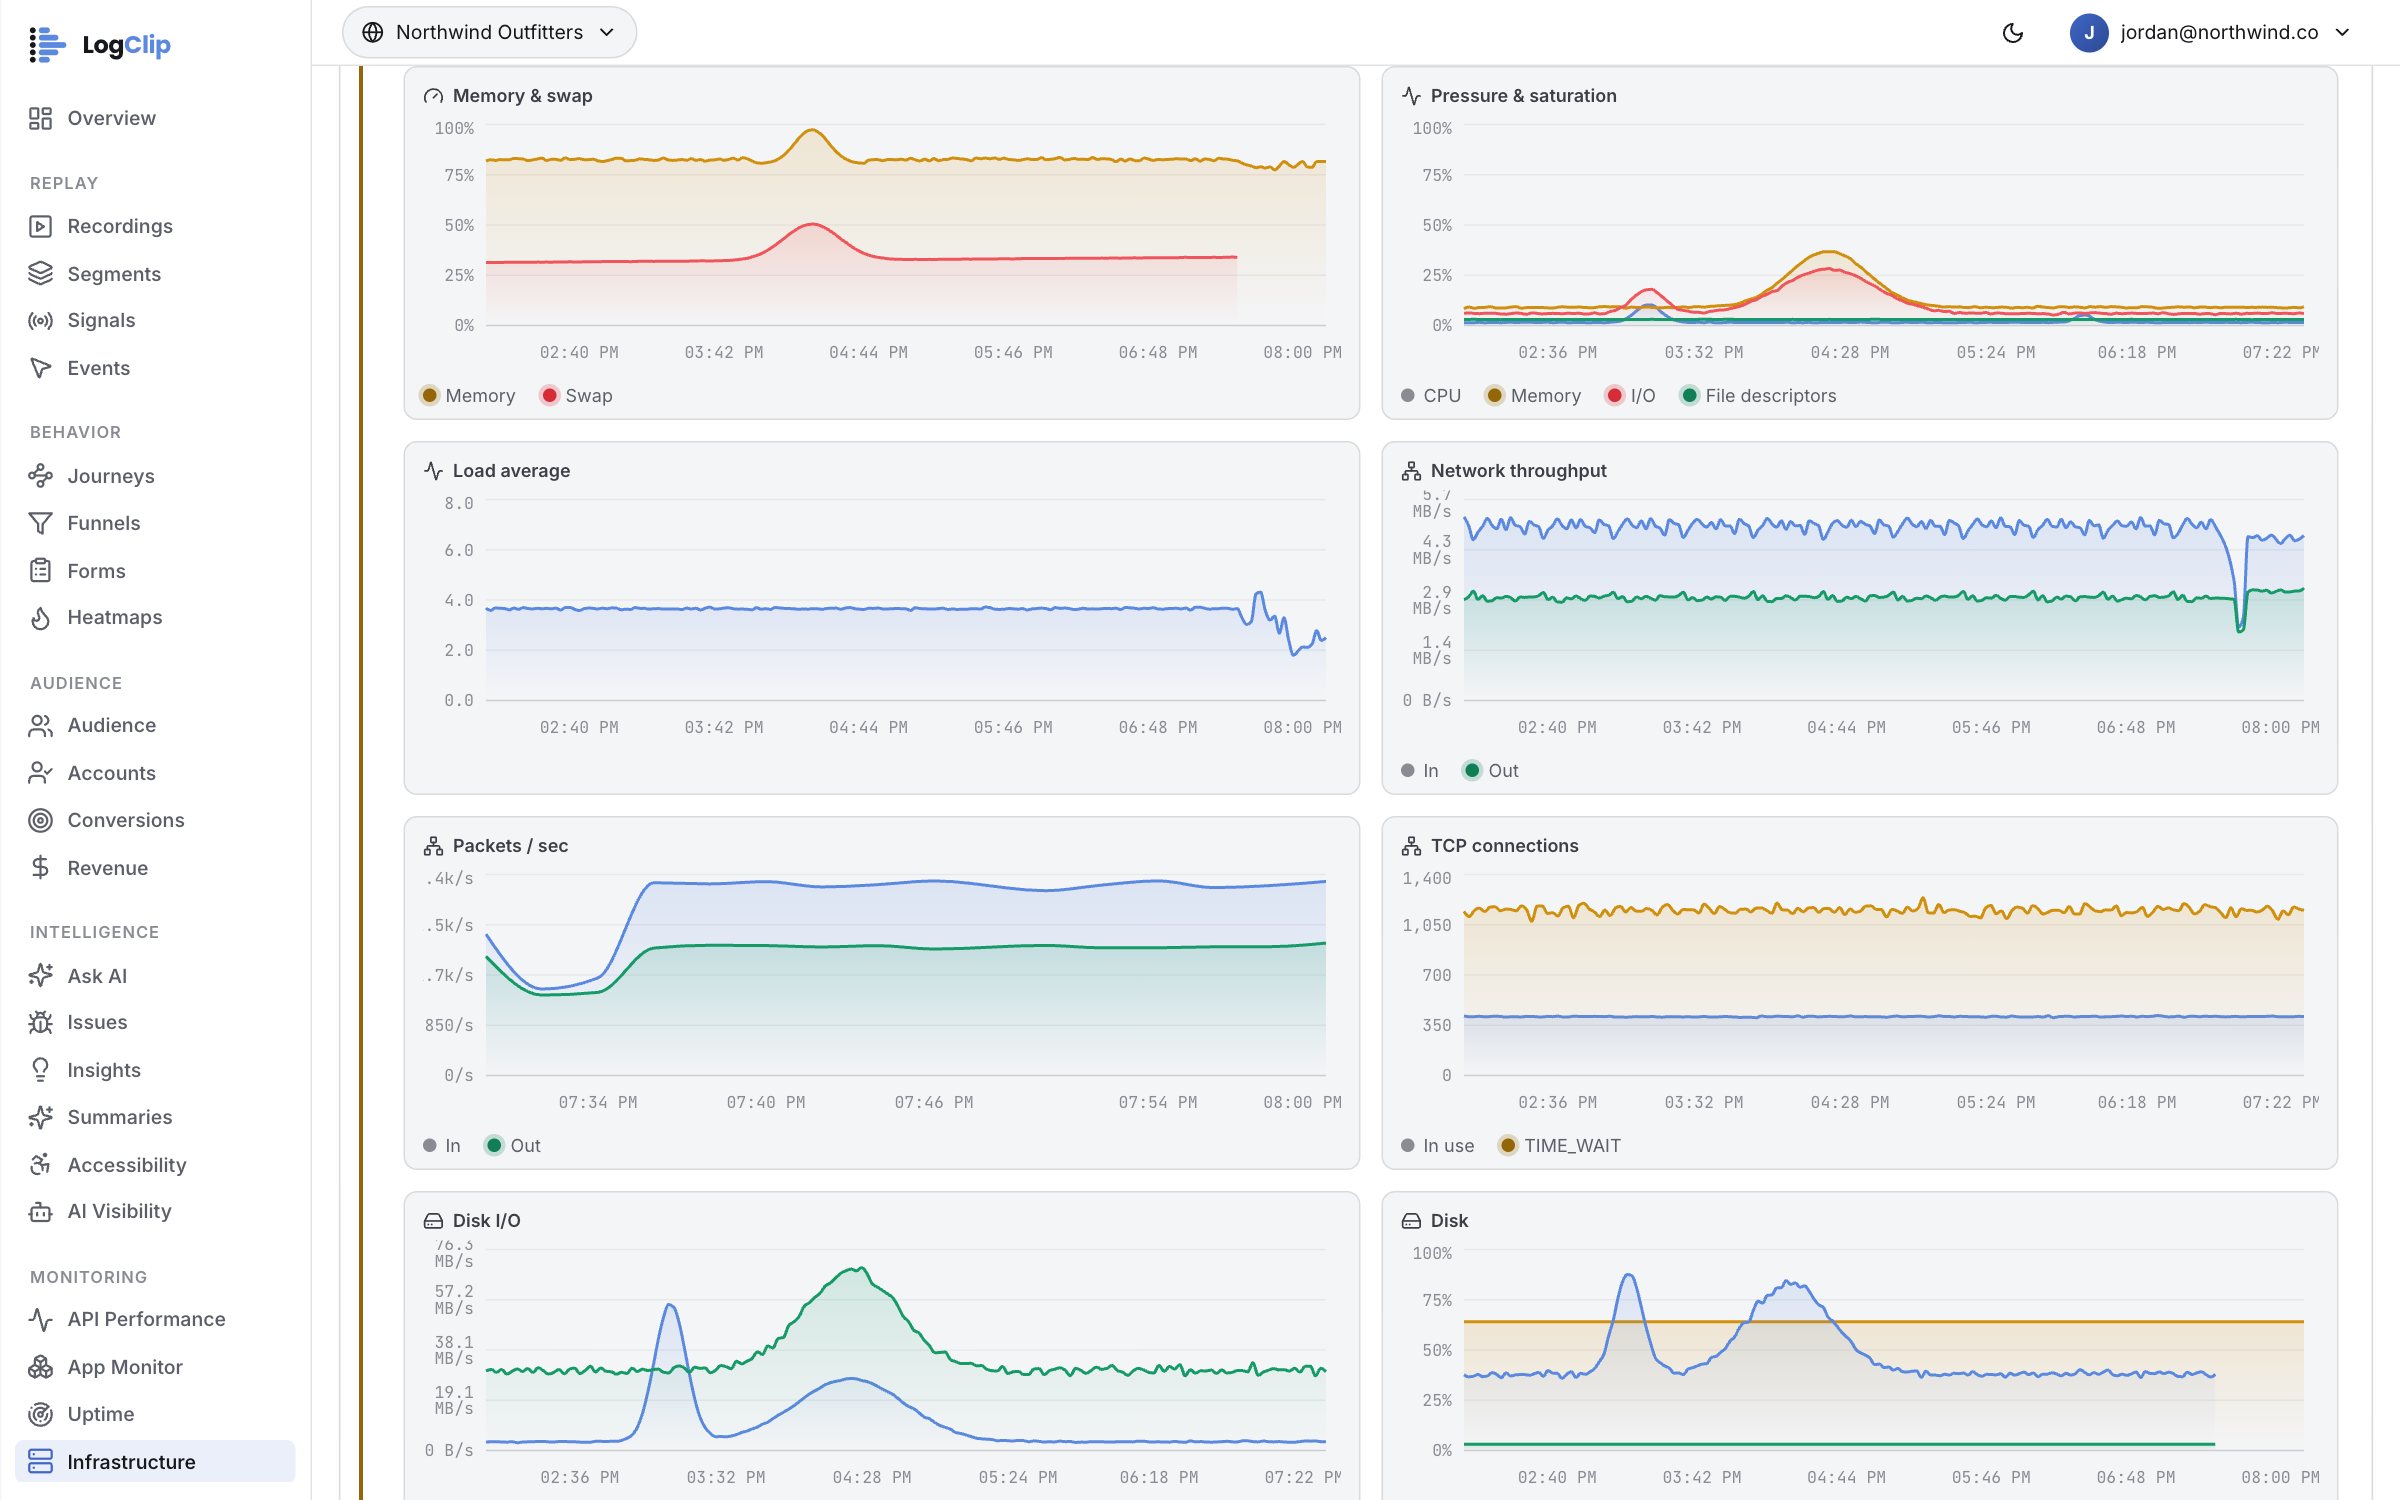


Stay fast, stay up, on the record.
Speed at the p75 real visitors felt, and probes on every site and endpoint every minute — the two numbers everyone asks about first, on the same timeline as the sessions.
Web Vitals
Core Web Vitals and API performance measured from real visitors — every endpoint, every page, on one timeline.
Uptime
Probe your sites and endpoints around the clock — status, latency, SSL expiry and incidents — with alerts by email, Slack or webhook and public status pages.
The server, reached from the session.
Replay tools stop at the browser. Here a failed request opens the trace that produced it, a slow query opens the session that ran it, and the host underneath reports in through one agent — one request, one ruler, top to bottom.
- Browserclick · Add to cart
- Browserfetch POST /api/cart→ 500
- ServerPOST /api/cart500 · 71 ms
- DatabaseSELECT carts
- DatabaseINSERT cart_itemslock timeout
- Databaserollback
- Hostweb-01 · healthy
- Hostdb-01 · mem 82%
W3C traceparent, on by default
The tracker stamps first-party requests; the server span carries the same id. One click joins them, in either direction.
OpenTelemetry, as-is
Point any standard OTel exporter at LogClip — Node, Java, Python, Go. No proprietary SDK, no re-instrumenting. Logs ride the same endpoint.
Two lines for the host
The agent installs from npm and enables itself as a hardened systemd service — CPU, memory, disk, network and the processes that matter. The install is in the Infrastructure section below.
The hosts underneath, watched.
One agent per host reads the box every ten seconds — CPU with I/O wait and steal, memory and swap, pressure, disk and network, sockets and file descriptors, and every service and container on it — on the same timeline as the sessions and traces. “The site feels slow” gets answered with the machine it runs on.
Host agent
Two lines per host. It installs from npm, enables itself as a hardened systemd service and reads /proc every ten seconds — no native dependencies, nothing to configure — with a process snapshot taken when CPU spikes, so the culprit is named.
Fleets, not zombies
Group hosts with --group and alert on the fleet’s size. A host that retires cleanly, or goes silent for an hour, stops alarming and keeps its history.
Workloads, not just the box
Every systemd service and container gets its own CPU, memory, pids and disk I/O from cgroup v2 — the host's pressure attributed to what caused it.
Requests, from the access log
Tail nginx, Apache or Tomcat logs on the host: throughput, status classes and p50/p95/p99 per route. No app changes, and no log lines leave the box.
Knows where it runs
AWS, GCP, Azure and DigitalOcean metadata labels the host with region, zone and instance type — and the autoscaling group becomes its fleet.
The fleet's network is totalled, never averaged, and its one warning is named rather than buried. From here, turn on tracing or log shipping for postgresql in one click — no second agent.
Backend · Log Management
Every log, tied to its trace.
Logs arrive with a trace id and are attached to the request that emitted them, so the line that explains the failure is already on the screen where you noticed it — beside the span, and one click from the replay of the person who hit it. No time window to guess, no second query language.